The tracked-account dashboard is designed to answer three questions: what is working, how the account is developing, and what to try next.
Start with the overview
Overview brings together recent engagement, video momentum, strongest posting hours, hashtags, audience locations, and standout videos. Use the more detailed tabs when you want to understand the pattern behind an overview result.
Audience metrics
The Audience section includes:
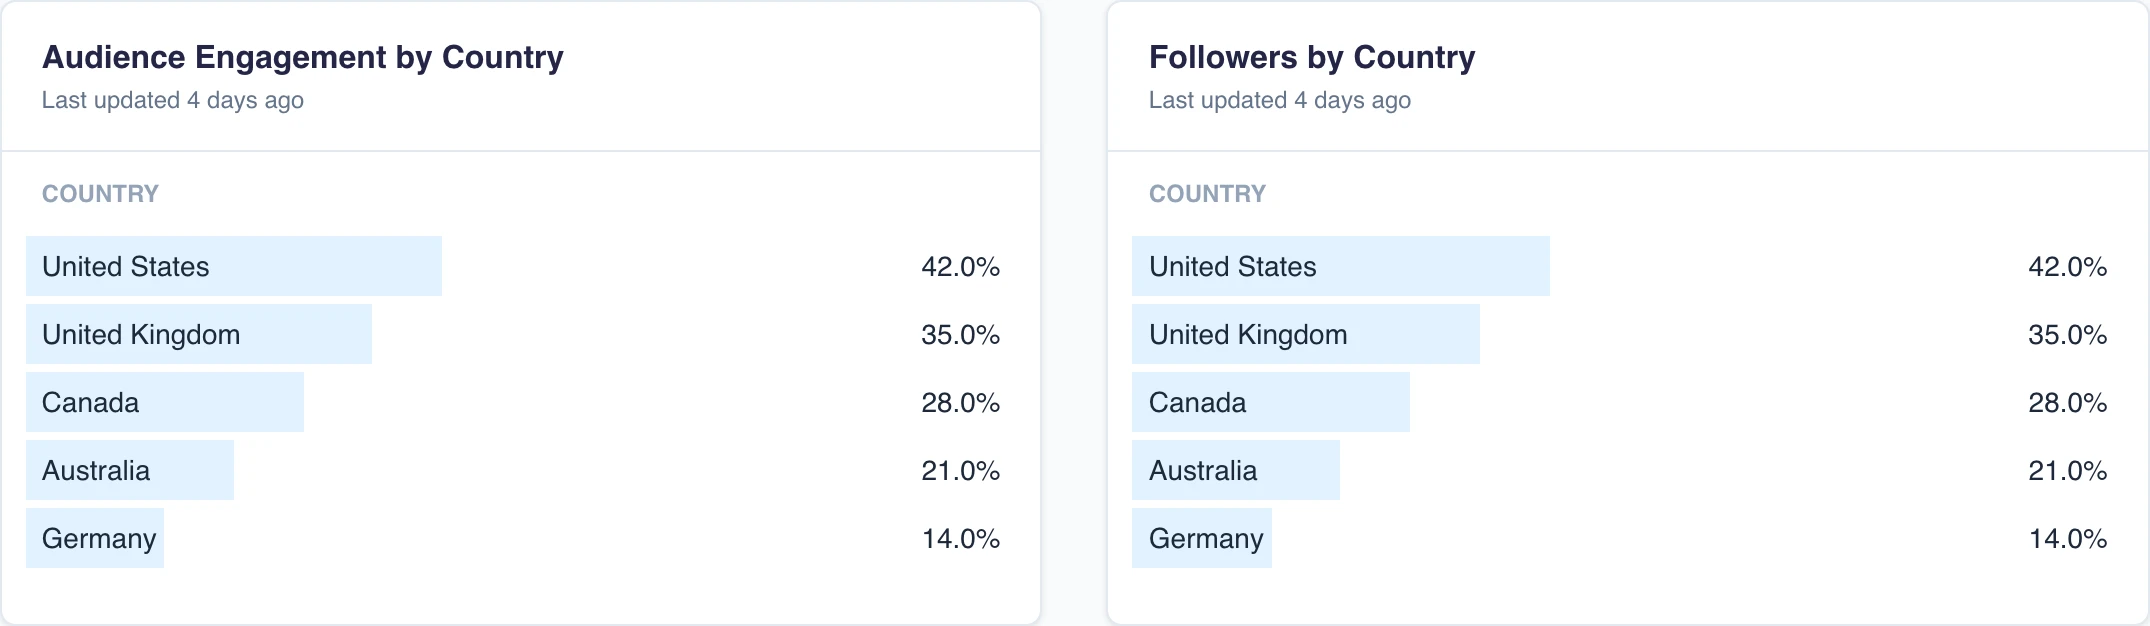
- Audience Engagement by Country shows the countries associated with recorded interactions on the account's content.
- Followers by Country shows the known geographic distribution of followers.
- Follower growth compares the latest follower count with an earlier point in the period shown.
Read these percentages separately: one describes where recorded interactions came from, while the other describes the known locations of followers.
Content-performance metrics
- Views count video plays, not unique viewers.
- Likes, comments, shares, and saves are the recorded interactions for a video.
- Average engagement rate (ER%) is the average across the 20 most recent non-pinned videos. A video's engagement rate is its likes, comments, shares, and saves divided by views. For example, 800 recorded interactions on 20,000 views gives that video a 4% engagement rate.
- The Average ... last 10 posts cards compare the latest 10 posts with the 10 before them, making it easier to see whether recent content is improving.
- Video momentum highlights recent videos gaining views faster than the account's established performance.
Timing, hashtag, and video comparisons
Time Analytics groups the account's previous results by publishing hour. Use it to find the hours associated with stronger engagement, views, likes, comments, shares, or saves.
Hashtags compares the average performance of the account's videos that used each hashtag.
Videos shows the individual posts behind the summaries. Sort the table to find the strongest videos for the metric you care about, or compare them with the latest and highest-engagement video lists.
Use these results as evidence of a pattern rather than a guarantee. A posting hour, hashtag, or content style that worked before is a useful starting point for the next test.
Compare like with like: use the same date range and metric, and compare a creator with their own previous results before drawing conclusions from another account.
Next steps
Return to Track TikTok accounts, or create a point-in-time snapshot with a Genius Report.